Using Google Analytics can be an extremely effective way to track your WordPress website’s performance. This solution can help you understand who your visitors are, what they are doing on your site, and what you need to improve to make your website more successful. However, if you have taken a glance at Google Analytics and not found it particularly self-explanatory or instantly useful, then you aren’t alone!
In this guide, we look at the key aspects of Google Analytics to help you get the most out of this free tool. We cover how to integrate Google Analytics with your WordPress website and get it up and running. We discuss the most important reports to monitor and what you can learn from them. And we look at how to set up conversion goals for your website track the results.
What is Google Analytics and What Does It Do?
Google Analytics is a platform that can track the user data from your WordPress website and compile it into useful reports. The reports Google Analytics creates can help you evaluate how your visitors interact with your website and monitor your site’s performance.
Much of the data recorded by Google Analytics focuses on the actions of your audience and the journey they take whilst on your website. This enables you to learn who your visitors are, what they respond well to, and how they engage with your site.
Using Google Analytics effectively will also give you a good insight into the impact your content, design, layout, and other aspects of your website is making. You can then tailor your site accordingly, making improvements and tracking the results to optimize your website and help it convert against its goals.
So now we know a bit about Google Analytics and what it does. Next, let’s look at how to set up Google Analytics and integrate it with your WordPress website…
Setting Up Google Analytics on Your WordPress Website
The first step of the process is to create an account with Google Analytics. If you already have a Gmail account, you can sign in with that. Otherwise, you will need to follow their sign up procedure. This is a quick and easy process and simply involves verifying your account via text or email.
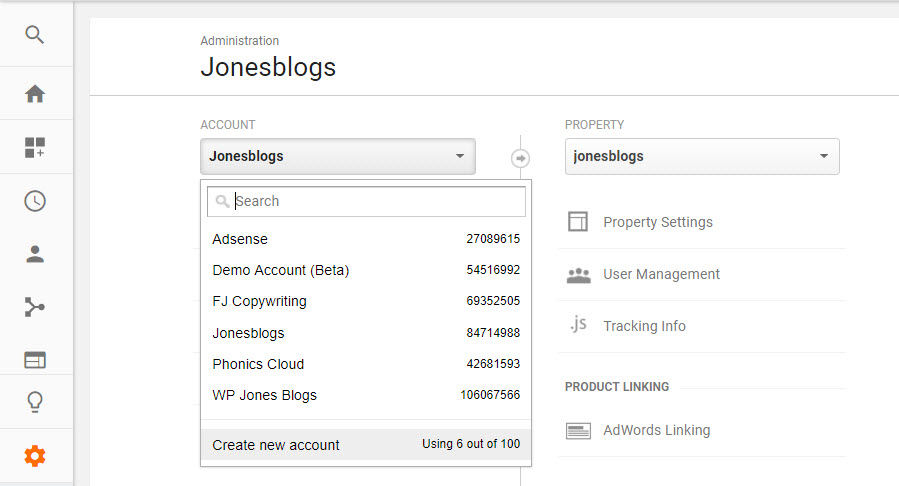
Once you have set up your Google Analytics account, within the dashboard, select ‘Admin > Account’. Here click on ‘Create New Account’. Complete the information on your website and then click ‘Get Tracking ID’.
Your new Google Analytics account is now set up. Now, switch over to your WordPress dashboard to integrate the two platforms.
Integrating Your WordPress Website with Google Analytics

The recommended way to connect your website with Google Analytics is to add a line of code to each page of your site. However, unless you are a confident coder this can be a daunting task. Luckily, there is a WordPress plugin that can take care of this for you.
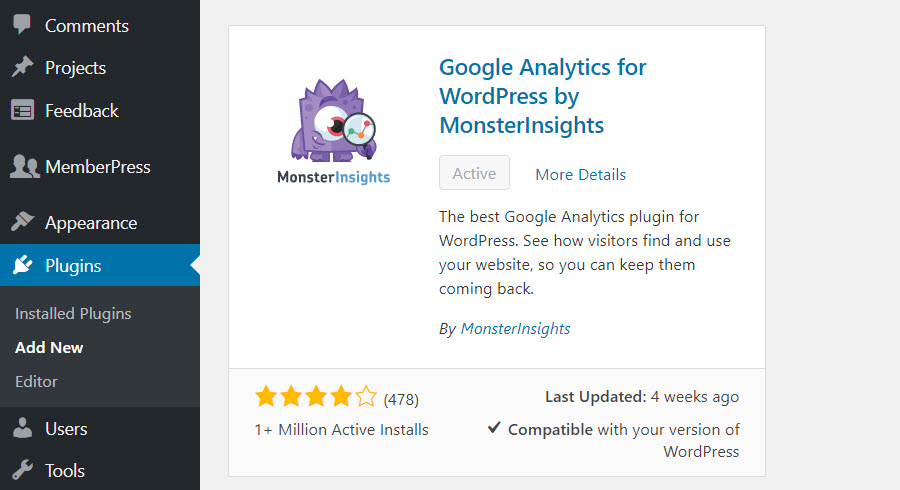
Google Analytics for WordPress by Monster Insights is a free plugin that can quickly and easily integrate your website with Google Analytics. Originally created by Yoast, the plugin was acquired by Syed Balkhi in 2016 and rebranded. A pro version of Monster Insights is also available, and necessary if you want to track advanced analytics on your site. For example, if you want sales tracking for your WooCommerce store or if you are looking to track your Google Adsense banner ads, then you would need to upgrade to a premium Monster Insights plan.
Installing the Monster Insights Plugin
Within your WordPress dashboard, from the menu select ‘Plugins > Add New’.

In the search bar type ‘Google Analytics for WordPress by Monster Insights’. When the plugin is displayed click on ‘Install Now > Activate’.
Monster ‘Insights’ will have now been added to your WordPress dashboard menu.

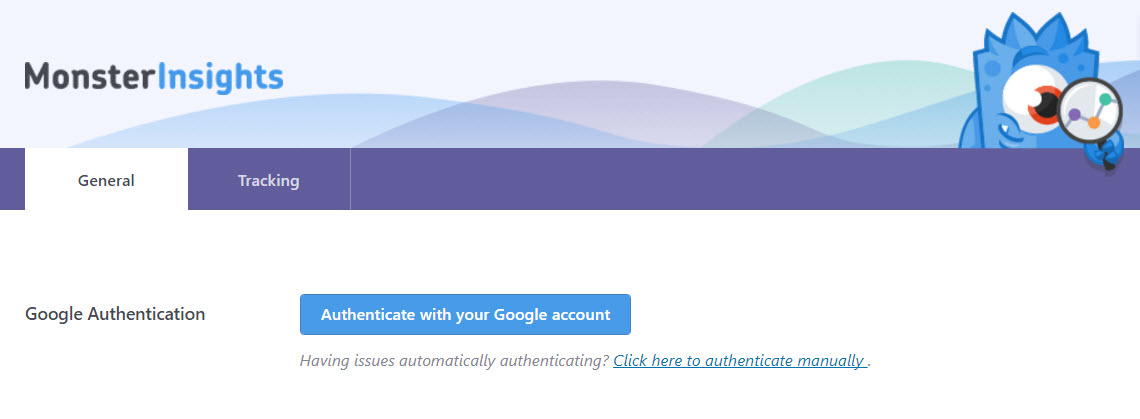
Select ‘Insights > Settings’ and click on the large blue button ‘Authenticate with your Google Account’.
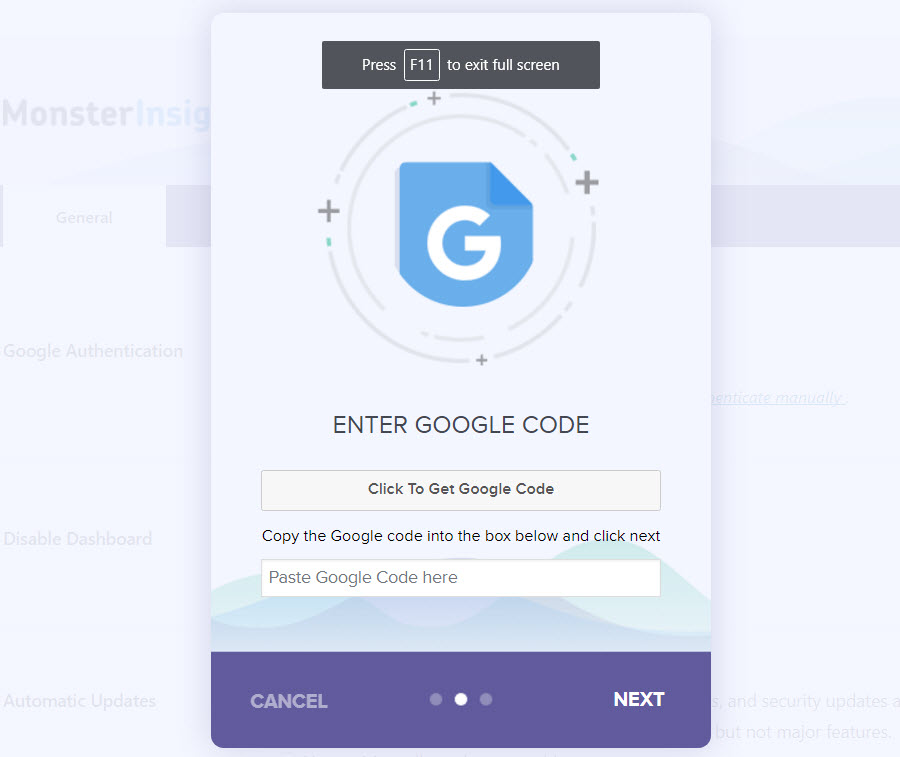
A popup will now appear that will help you authenticate and connect your accounts. Here you will need to add your Google code. Select ‘Click to Get Google Code’.
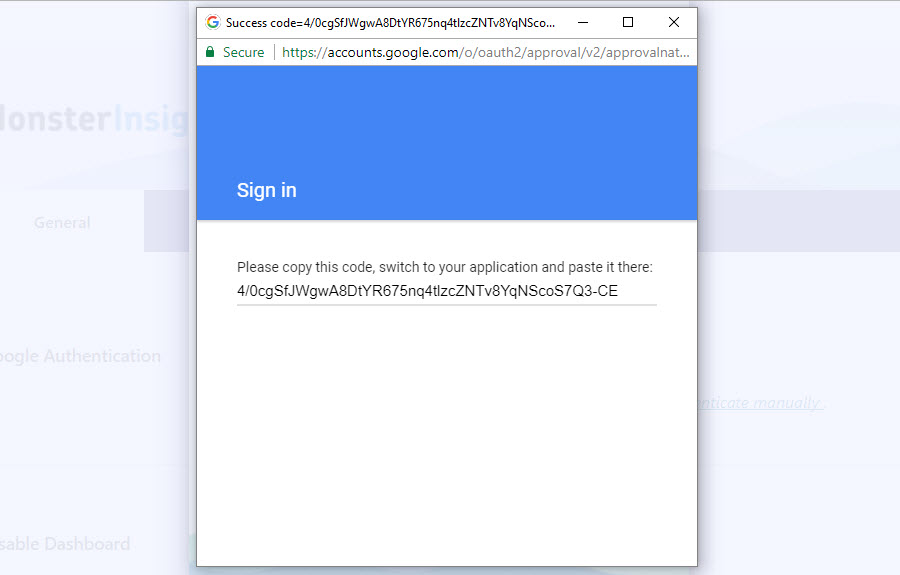
Sign into Google Analytics and copy and paste the code provided into the popup in your WordPress dashboard.
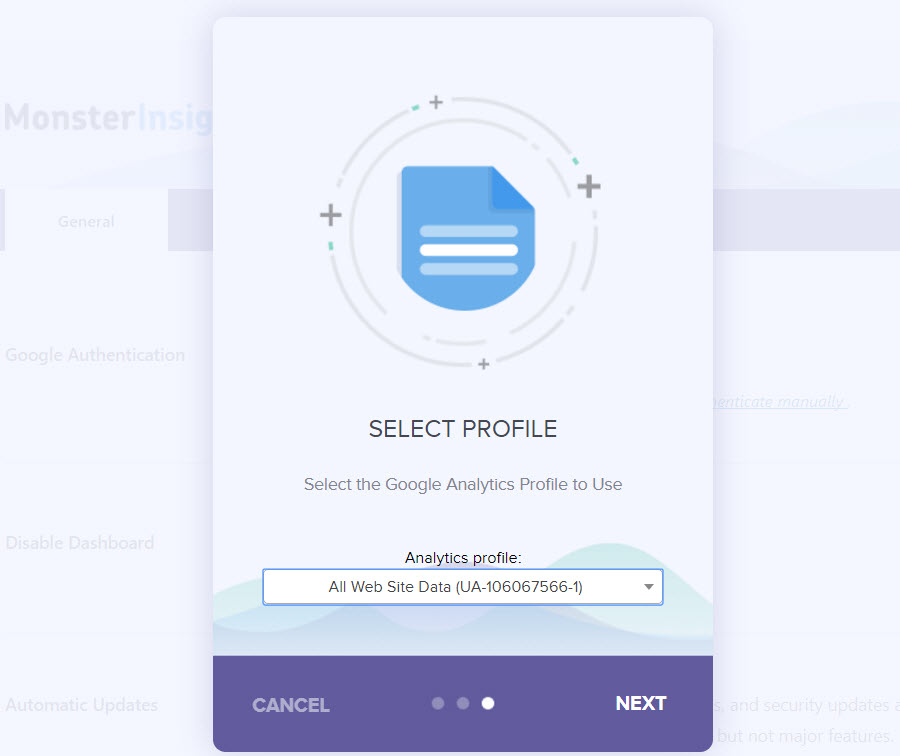
Select your profile that you want to track (which is your website) and then Google Analytics will do the rest!
Your WordPress website and Google Analytics account are now integrated, and your site’s data will begin to be tracked.
An Overview of Google Analytics Reports
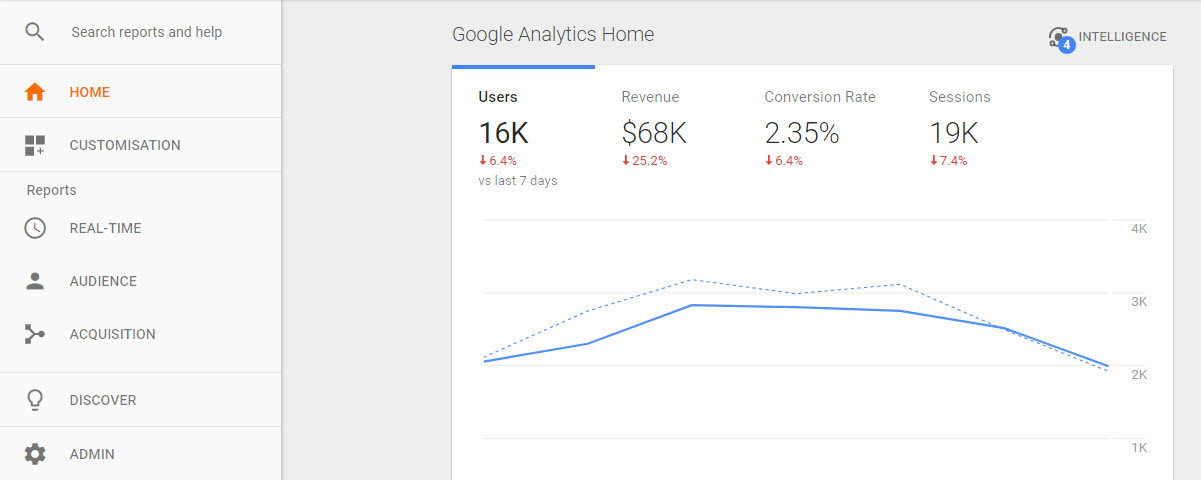
Once you have set up Monster Insights on your WordPress website, Google Analytics will be able to record and analyze your data. It will then be presented in comprehensible charts and tables.
Google Analytics reports on numerous aspects of your website and its audience. These reports can be accessed via the menu on the left-hand side of your Google Analytics dashboard. Reports are grouped into five sections…
- Real-Time
- Audience
- Acquisition
- Behaviour
- Conversions
Each one of these sections displays an ‘Overview’ page, summarizing the key results in easy to understand displays. So let’s have a quick look at what information each of these report types contains…
Real-Time Reports
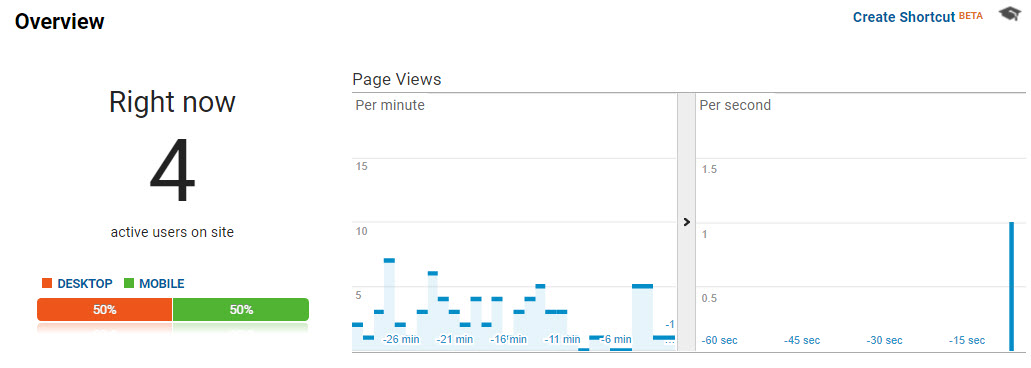
Real-Time Reports give you a live insight into what your audience is doing on your site. Monitor behavior on-site, see what pages people are reading, where they have come from, and if they are converting against your website goals. This feature can be very useful as it makes you aware of any problems as they arrive. You can then instantly make alterations to your site to improve the user experience.
Audience Reports
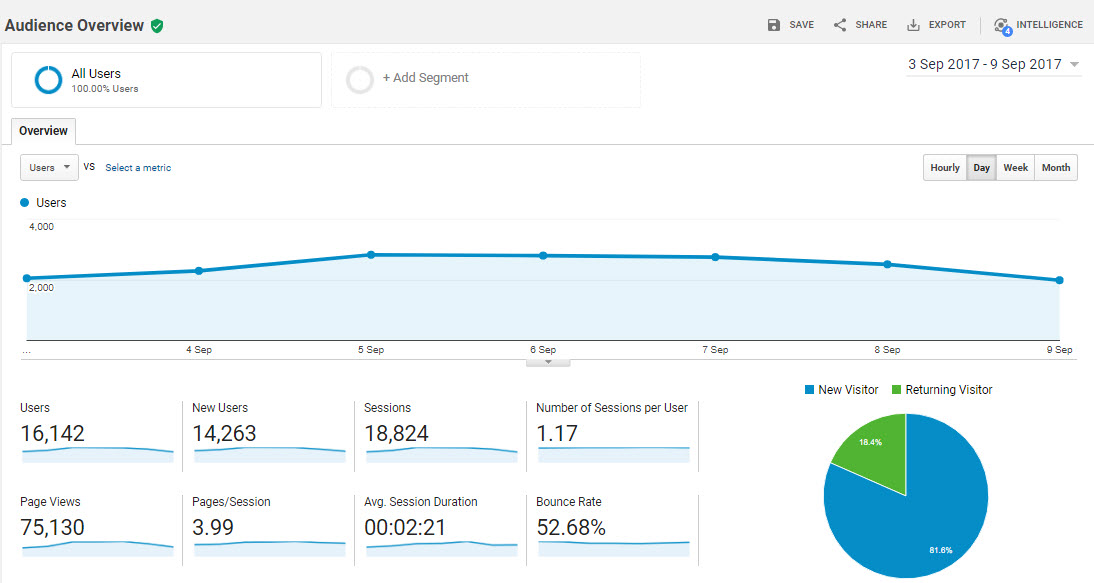
Audience Reports enable you to learn about your site visitors in detail. Learn where they are from, their age and gender, their hobbies and interests and much more. You can also see what type of device they accessed your site on, how engaged they were with your content, and whether they are new or returning visitors.
This information will give you a precise picture of your audience, and help you understand their characteristics. You can then tailor your website design, and guide your content and marketing strategies, accordingly.
Acquisition Reports
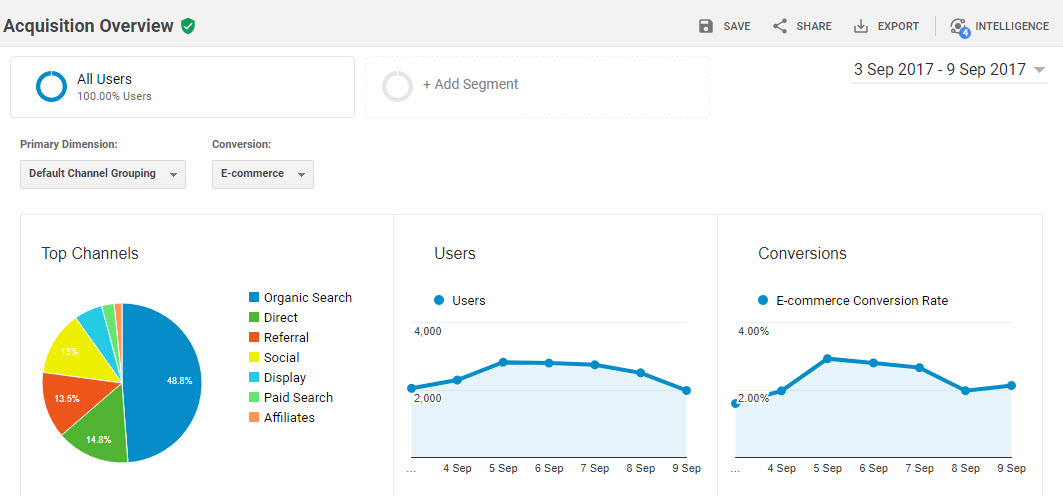
Acquisition reports show which channels your audience arrive on your site from. Visitors often come from numerous sources including social media, other websites, search engines, and email. Here are the different types of channels, that Google Analytics reports on, explained…
- Organic Search – Traffic that arrives on your site from search engines (but not from paid advertisements).
- Paid Search – Traffic from paid ads in search engines.
- Social – Click throughs from social media channels.
- Direct – People typing your site’s URL into their browsers.
- Referral – People clicking on links from other site’s to get to your website.
- Email – Click throughs from links in emails.
- Other – A group of low volume traffic sources.
Use this information to compare the performance of different marketing channels. Track to see if your social media campaigns are working, if your blog posts are reaching your target audience in the search engines, if your paid ads are driving traffic, and more.
Behaviour Reports
Behaviour reports give you an in-depth understanding of how your visitors engage with your WordPress website. Reports show which pages people viewed as well as their landing and exit pages. This can help you see what content is most popular, and help you make changes to content to help increase the time your visitors spend on your site.
Conversion Reports
Google Analytics allows you to set up goals to track that are specific to your WordPress website. Goals could include lead collection, time spent on-site, particular pages viewed, or monetary values achieved, to name a few.
The Conversion Reports show how your website is performing in relation to the goals you have set, and whether it is converting against these goals. These reports are a crucial reporting tool, as it enables you to see if your website is performing and achieving its objectives.
Useful Reports to Track
You should now have a basic understanding of the different types of reports Google Analytics produces. Let’s next have a look at a few of the most interesting and useful reports that Google Analytics creates, and discuss what you can learn from the data displayed.
Active Users Report
The ‘Active Users’ report can be found under ‘Audience > Active Users’. This report shows how many users have had at least one session on your site within a certain time frame. At the top of the graph, you can opt to show data for active users in the last day, 7, 14 or 30 days.
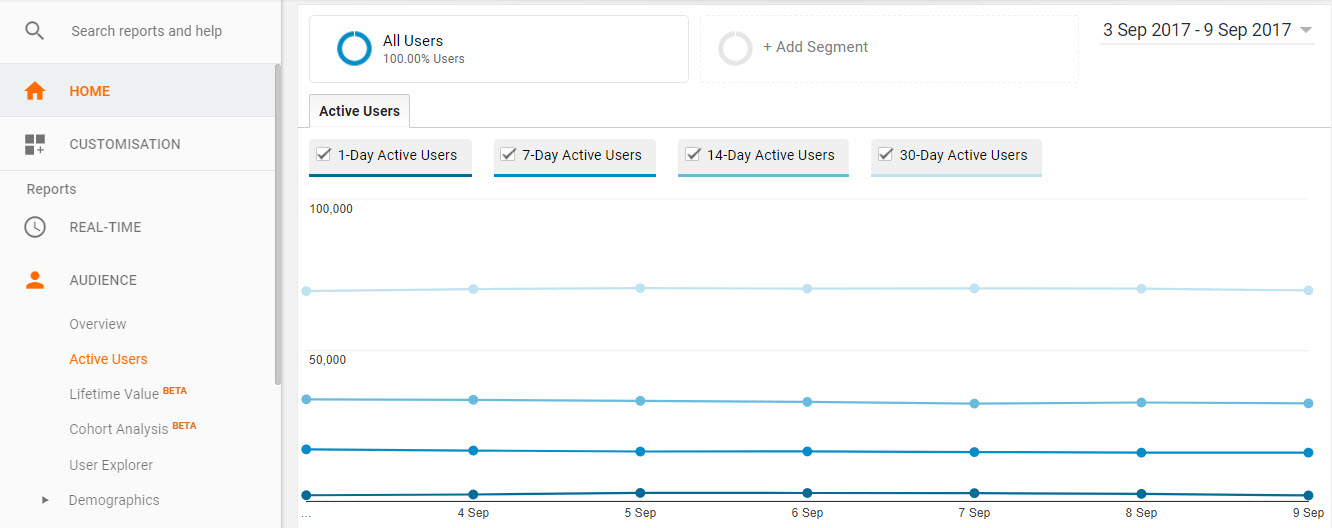
This graph will help you understand if your site’s reach is expanding. If your marketing activities and content are paying off you should see an increase in active users over time. If your active users are not increasing, look next at ‘new v returning visitors’ to see whether you need to concentrate your efforts on reaching new visitors or retaining old ones.
New v Returning Visitors Report
It is important to receive high numbers of new and returning visitors if your WordPress website is going to thrive. To grow your business, you want your website to be constantly reaching new audiences, engaging with new potential customers and for new visitor numbers to increase over time. However, building a community of regular followers that you can promote your content, products or services to is equally essential.
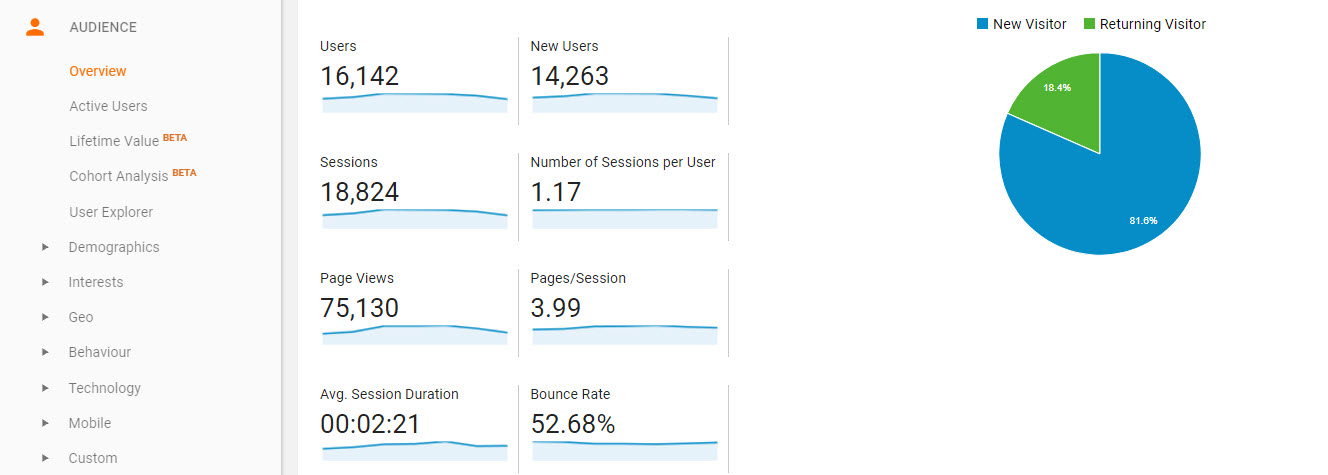
Therefore, ‘New v Returning Visitors’ is an important metric to track. If your site’s ‘new’ visitor numbers are low, then you need to consider implementing strategies to drive traffic to your website. This could include starting a blog to improve your rankings in the search engines, promoting your content on social media channels, or advertising aimed at targeting new users.
On the other hand, if your website’s ‘returning’ visitor numbers are down you should concentrate on improving what you are offering on your website. Looking at where your audience is exiting your site (which we will discuss in due course) will give you an insight into what is driving your visitors away. It could be the quality of the content, the user experience on site, slow loading times, or something else.
A summary of ‘new v returning visitors’ can be found under ‘Audience > Overview’. Further down the menu under ‘Audience > Behaviour > New vs. Returning’, an in-depth report will provide a comparison breakdown of user numbers, session times, bounce rates and more.
Engagement Report
The more time your audience spends on your WordPress website the better. Time on-site is more likely to equal site conversions, whether this is lead generation, sales or returning visitors. If the time spent by visitors on your site is short, then you need to look more closely at where your visitors are leaving to see what you can improve, whether that is content, usability, or something else.
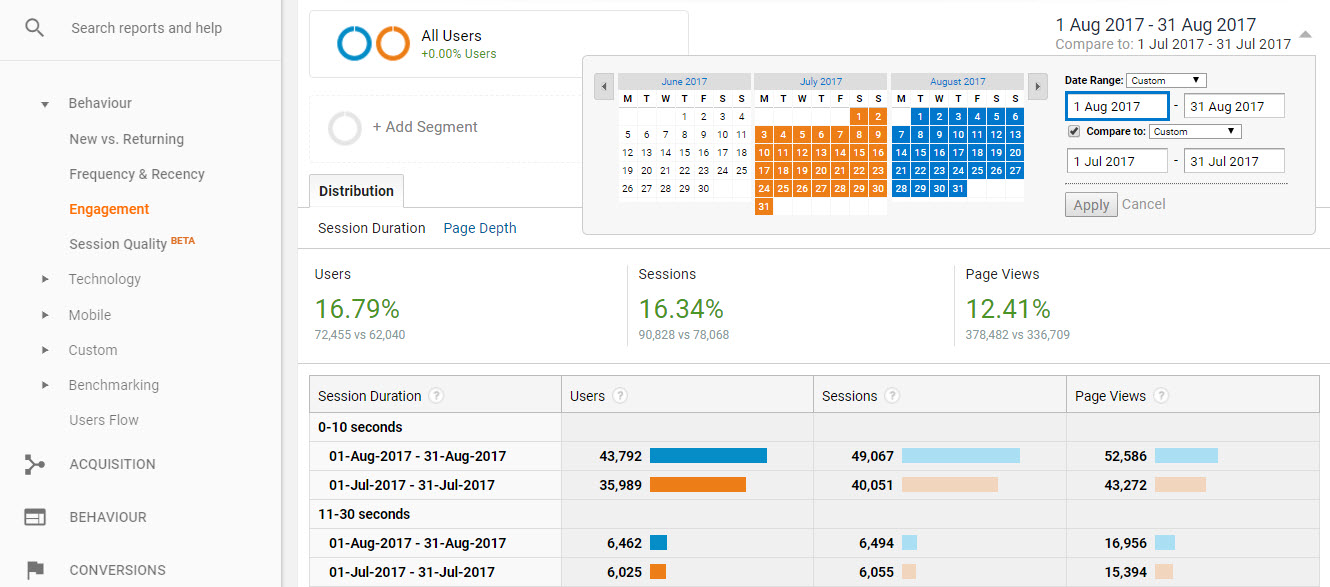
‘Time on Site’ can be found under ‘Audience > Behaviour > Engagement’. In the top right-hand corner of this page, you can alter the time period the results are displayed for. By clicking ‘compare’ you can also compare two different time periods. This can be particularly useful if you have made improvements to your website in regard to trying to prolong visitors duration on your site. Here you will be able to see if your audience’s time spent on your site has increased, and your hard work has paid off.
Location Report
The ‘Location’ report is another useful Audience report. Located under ‘Audience > Geo > Location’ this data shows where your visitors are accessing your WordPress website from. Using the IP address of each user, Google Analytics can determine which countries and cities your visitors are based in.
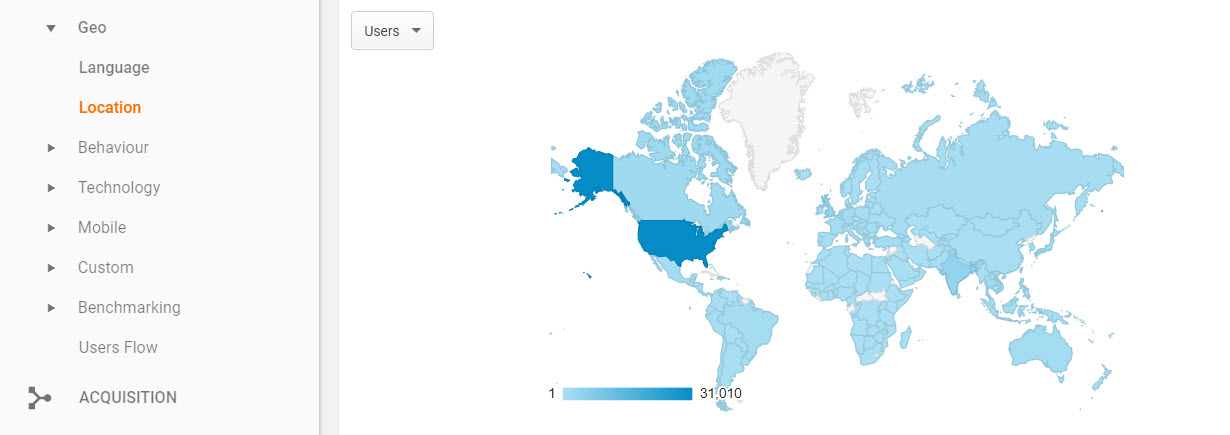
The geographic heat map displayed on this page shows where the majority of your customers are based, giving you a clue as to where you should concentrate your efforts.
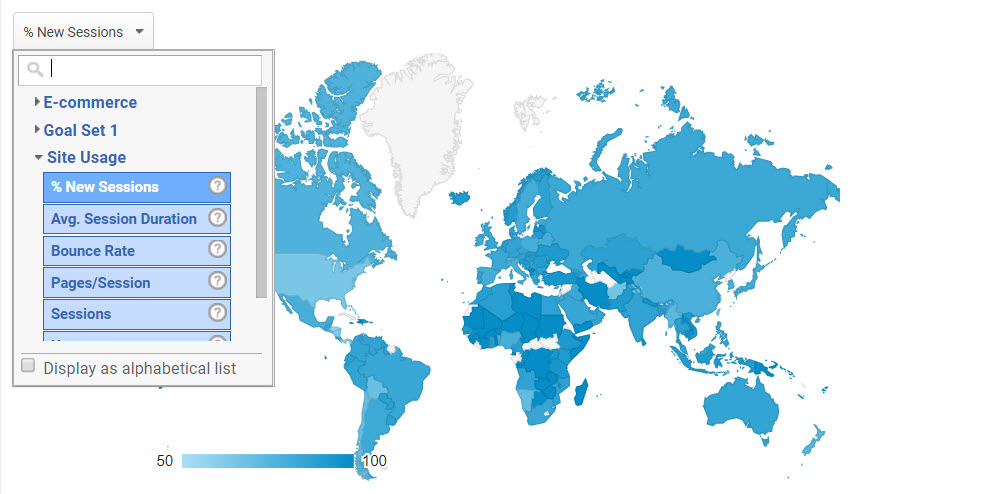
This map can also be adjusted to show a variety of different metrics. On the top left-hand side of the map, in the drop down menu select ‘% New Sessions’. This will help you identify potential new audience markets to target.
Mobile Performance
Understanding how your audience consumes your site’s content is instrumental in your web design process. The ‘Mobile’ reports can show your site’s performance on different devices. This information will enable you to fine tune your site’s functionality, so your visitors receive a high-quality user experience on all devices and browsers.
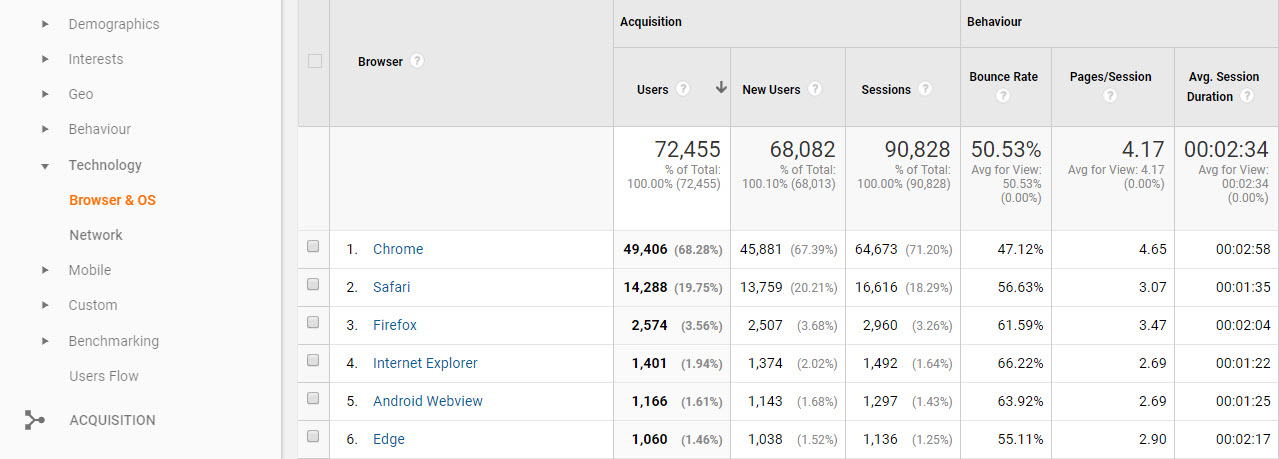
Select ‘Audience > Technology > Browser & OS’. Here you will get a clear picture of the browsers that are being used to access your site, and if there are any issues with particular browsers. For example, if your site has a comparatively high bounce rate on a mobile browser then you may need to consider improving the mobile version of your site.
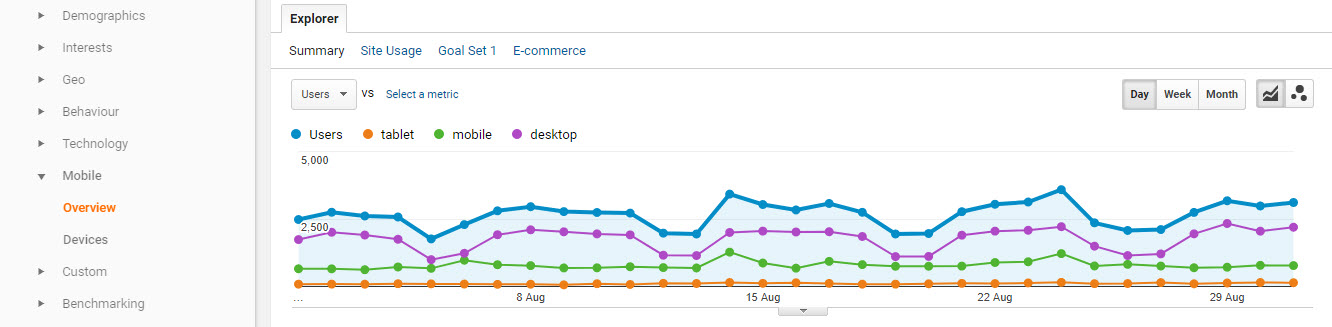
Under ‘Audience > Mobile > Overview’ you can also get a breakdown of your traffic based on desktop, mobile, and tablet usage. Tick the boxes next to these three device types in the table, and then select ‘Plot Rows’. The data will be now presented within the graph above, enabling you to track how mobile usage of your site has increased over time. The information in these reports should be used to help improve your site’s design and usability, making your website best suited for the devices your visitors are using.
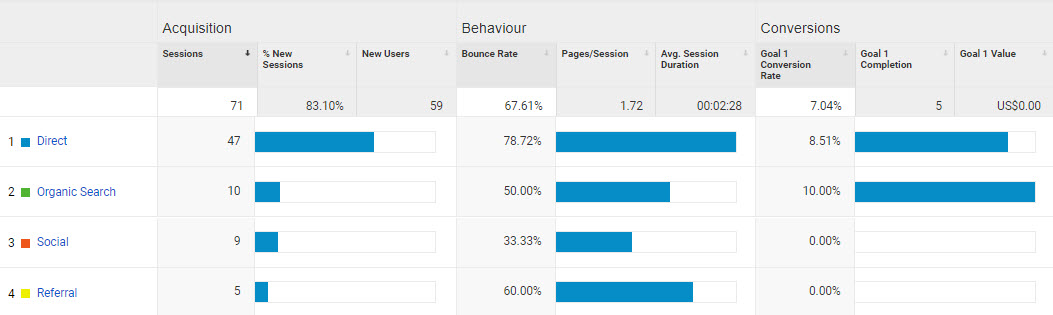
Acquisition Overview
The ‘Traffic’ reports in Google Analytics can show where your visitors are arriving from and exactly how many users are coming from each medium. A breakdown of where traffic to your site is coming from can be found under ‘Acquisition > Overview’.
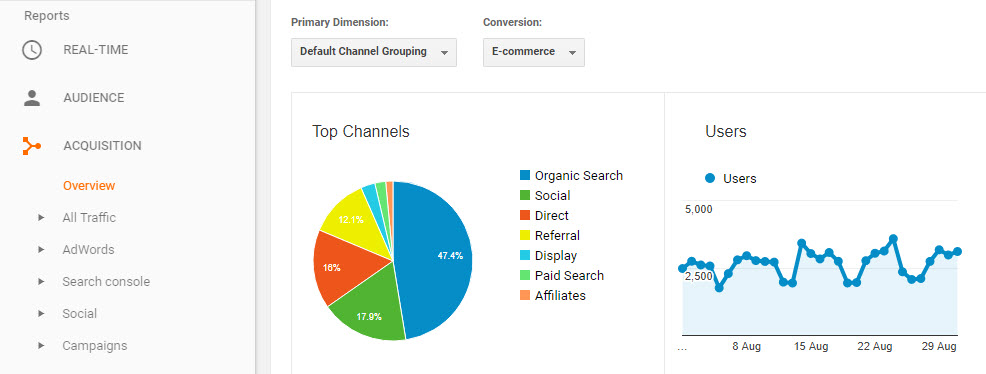
Understanding where your website’s traffic is coming from will show you if your current marketing and website promotion strategies are working. This data can then be used to help inform your future marketing strategy. If you have launched a large social media campaign, it is here you will be able to see if this campaign has paid off and traffic from social media has increased. Or if you have recently written numerous guest posts, you would expect to see an increase in ‘referral’ traffic. However, if your ‘organic’ search numbers are low, you may well need to put in some work targeting keywords in your blog posts.
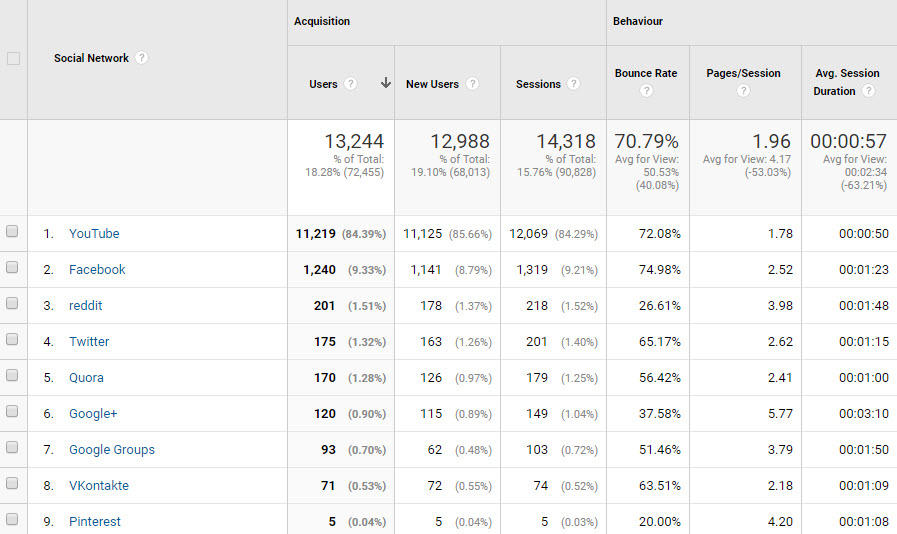
These reports can also help pinpoint where your audience is hanging out. For example, if you click on ‘Social’ you will see a breakdown of ‘sources’ showing the specific social media channels that send traffic to your site. This should inform your planning for future social campaigns, ensuring that you target channels where your target audience are most present and don’t waste your time on social platforms that won’t increase traffic numbers.
All Traffic Reports
Ideally, traffic should be high quality, meaning that the visitors that are arriving on your site are converting against your site’s goals. More detailed reports can help identify if you are attracting the ‘right’ type of traffic. Under ‘Acquisition > All Traffic > Source/Medium’, you can compare the traffic arriving from each source with bounce rate.
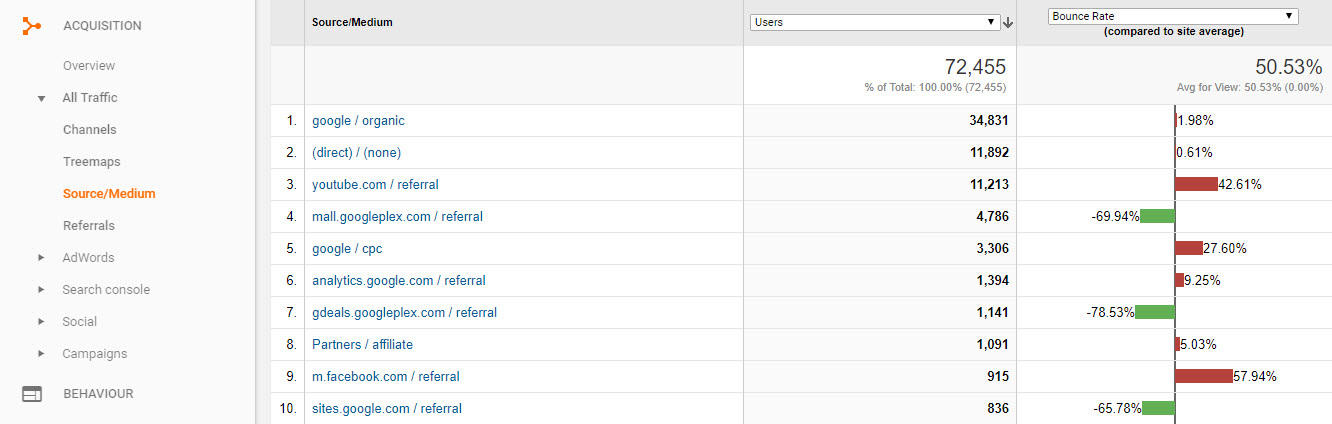
To do this select the ‘Comparison’ icon in the top right corner above the table. Then from the two drop down menu bars, select ‘Users’ in the first and ‘Bounce Rate’ in the second. The results will show you how many users are arriving at your site from each source, and what percentage of these users bounce from your site, never visiting more than one page.
If you receive a high percentage of traffic from one source, but the bounce rate for that source is particularly high, then it probably means that this audience does not like what they are seeing when they reach your site. If this is the case you should study your landing pages (covered further on in this article) to see what content is not appealing to this category of visitor. You can then change the landing pages accordingly, adding valuable content, and monitor the results to see if the bounce rate for this traffic stream decreases.
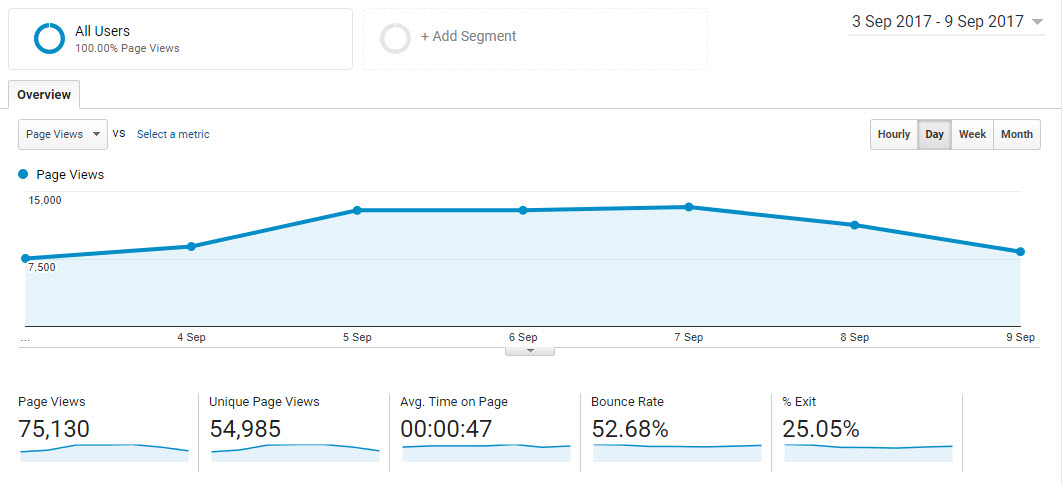
All Pages Report
You can track your pages performances under ‘Behavior > Site Pages > All Pages’. Here you get a good overview of which pages on your WordPress website receive the most traffic.
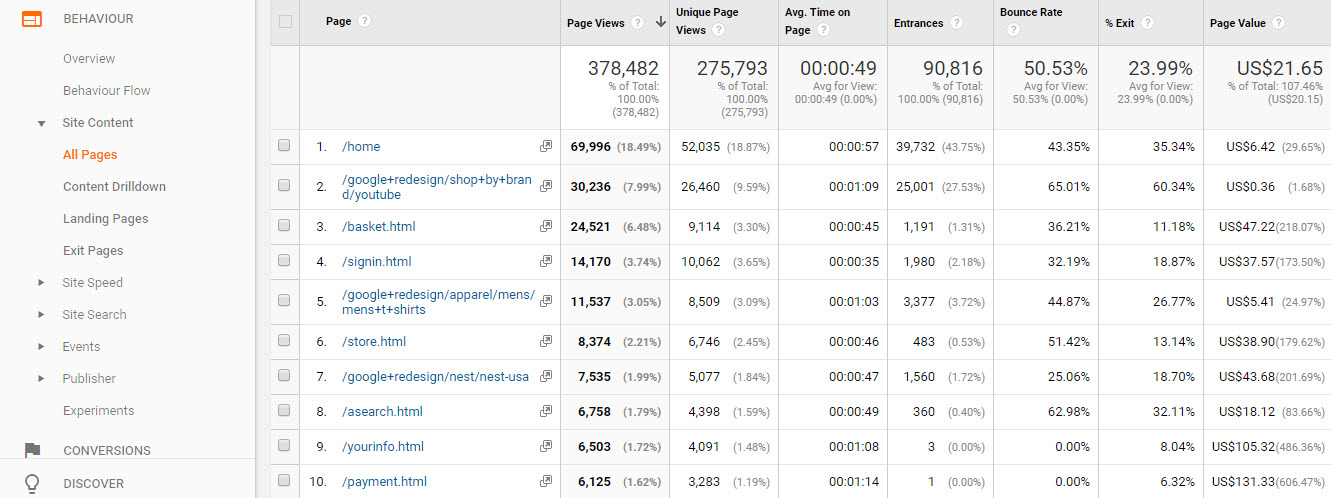
Other metrics in this report, like the ‘average time spent on page’ and ‘bounce rate’ indicate how engaged your visitors were with the content on these pages. This report will help you quickly see what content appeals to your audience. Popular pages should guide your future content strategy. You can also identify low performing pages, which will need immediate adaptations.
Landing Pages Report
The ‘Landing Pages’ report shows the pages where your visitors arrive on your site. This can be found under ‘Behavior > Site Pages > Landing Pages’. This report is particularly useful in relation to bounce rate.
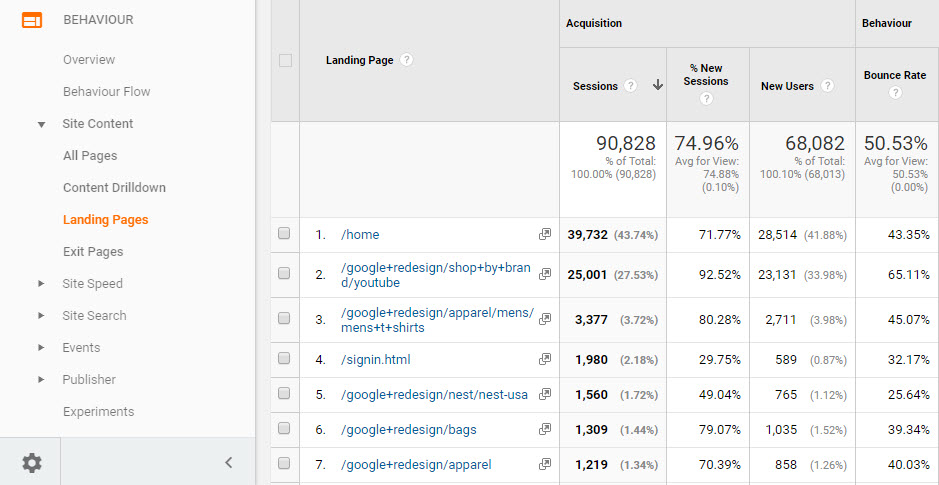
Look carefully to see which landing pages have accumulated a high number of bounce rates. A high bounce rate is usually an indication that the content is not valuable or relevant to the new arrivals. Compare landing pages with lower bounce rates to see what aspects of the badly performing pages you can improve.
Exit Pages Report
The Exit Page data can be viewed under ‘Behavior > Site Content > Exit Pages’. Exit pages show where users, who have visited more than one page, left your site. To get a clear picture of your exit pages, at the top of the table on the right-hand side select the ‘Percentage’ icon. You will now see your exit data presented in a pie chart, enabling you to easily see which pages have the highest exit rates compared to others.
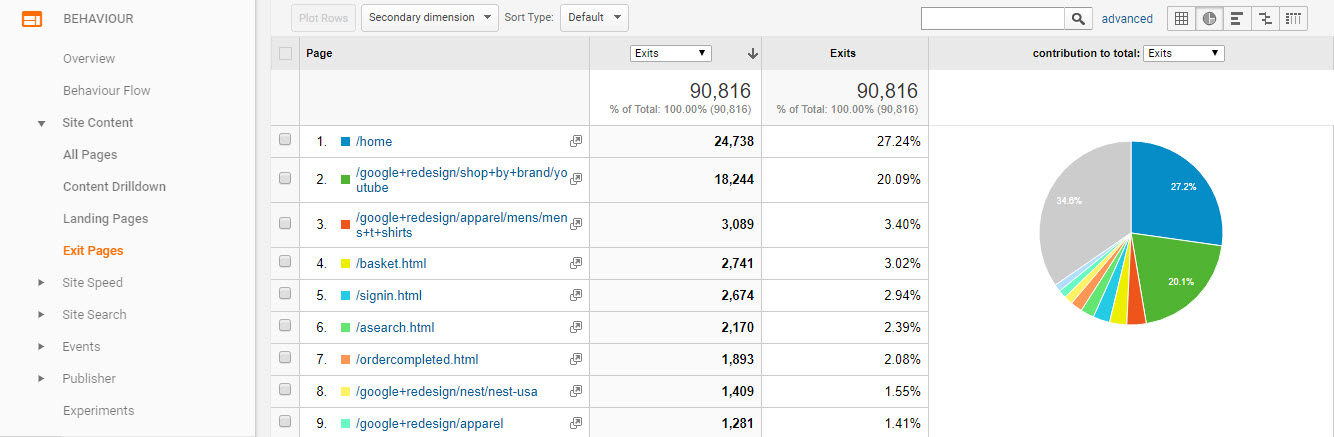
Some pages you will expect to have high exit rates. These would be pages like ‘thank you pages’, or ‘checkout completion’ pages. However, other pages may have high exit numbers that will surprise you. It is here you may be losing visitors due to poor site usability, poor content, or other reasons that you need to get to the bottom of.
Setting Up Goals to Measure Your WordPress Website Conversions
As mentioned earlier, Google Analytics allows you to set up goals so you can track and measure your website’s conversions. The goals you set should be closely linked to your site’s objectives.
For example, if one of your website’s aims is to collect leads, then create a goal to monitor whether this is being achieved. Other goals could include visitors completing discrete actions like a session to a ‘thank you’ page, a ‘download completed’ screen, a purchase for a specific amount, or a minimum session duration.
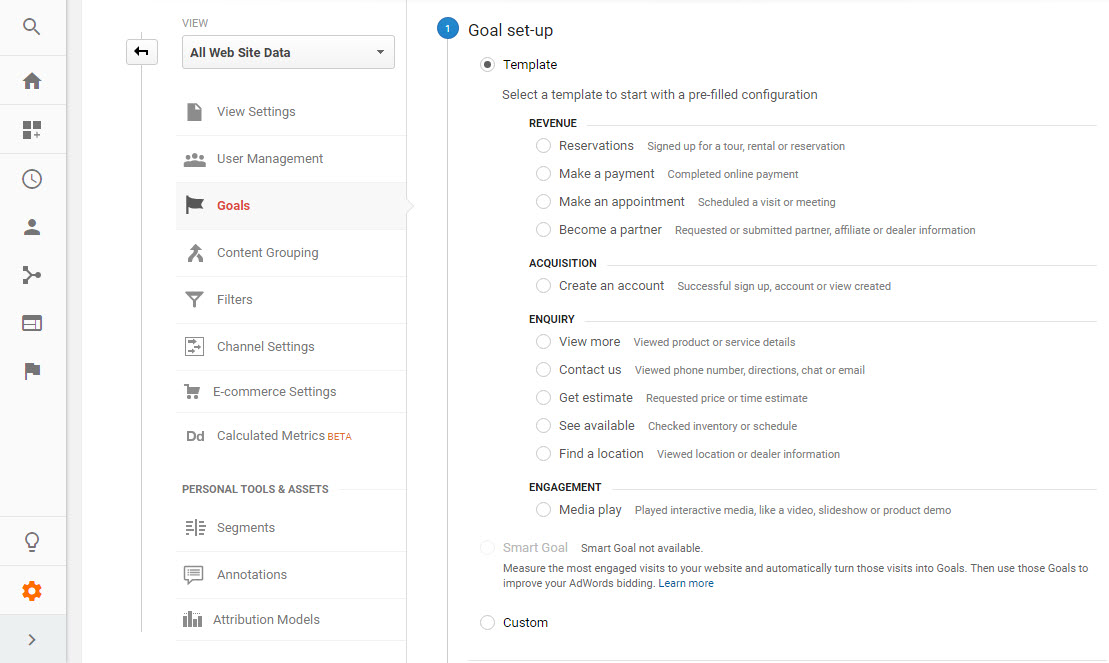
To set up a goal, click on the ‘Settings’ icon in the menu bar. Under ‘View’ select ‘Goals > + New Goal’. You now need to choose the type of goal that you want to create and follow the instructions to do so.
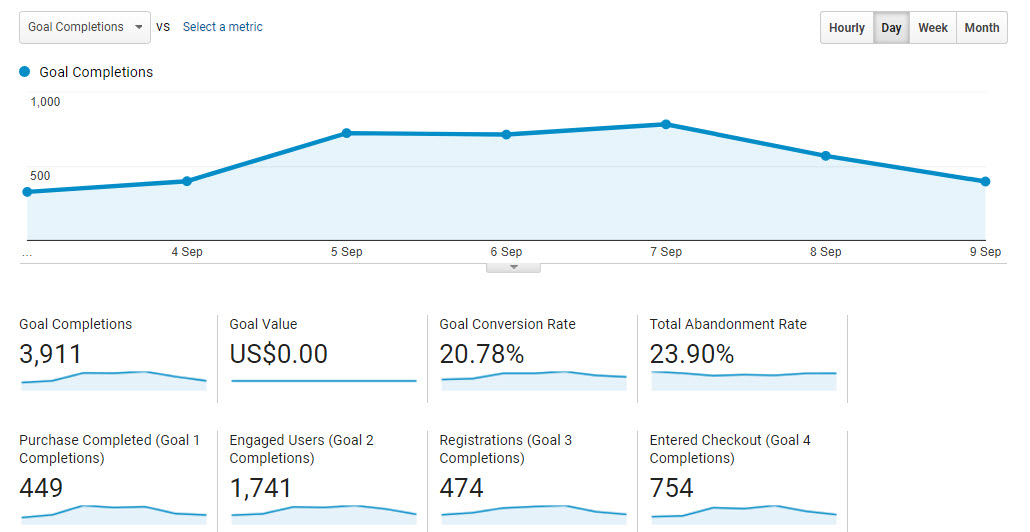
Goal Reporting
Once you have created your goals, you can view the ‘Goal’ reports under ‘Conversions > Goals > Overview’. Here you can see if your website is converting against the goals you have set it.
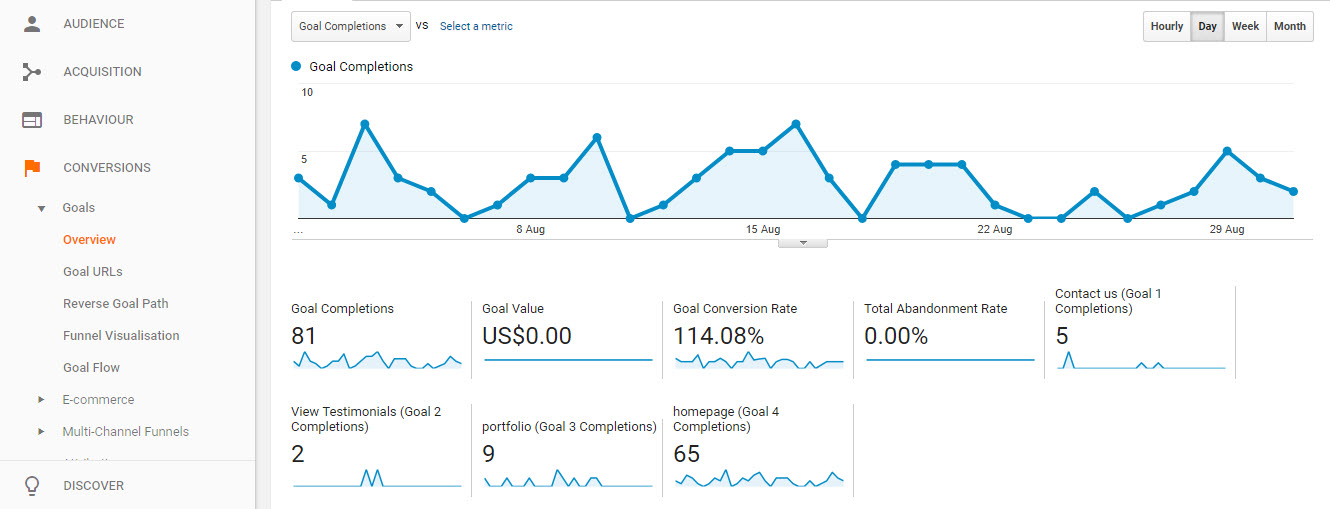
Importantly, goal data will also be shown within almost all of your other analytics reports. This can be very useful when analyzing some of the reports we have looked at previously. For example, when looking at the ‘Behaviour’ reports, your conversion data can show you which are your best converting landing pages. The ‘Acquisition’ reports can breakdown which sources of traffic create the highest number of conversion. And, the ‘Audience’ reports can help you understand which countries produce the highest conversion rates.
This data is invaluable, as it shows what aspects are working on your site, and achieving the results you need. You can then use this information to improve other areas of the site that are under achieving in comparison.
Google Analytics App
To make it easy to analyze your website data and reports, Google Analytics has created its own app. With this Google Analytics app you can track your key metrics and get answers about your site’s performance from your mobile or tablet in real time. Using this app is an effective way to keep up to date with what is happening on your site and monitor your business on the go.
Using Monster Insights
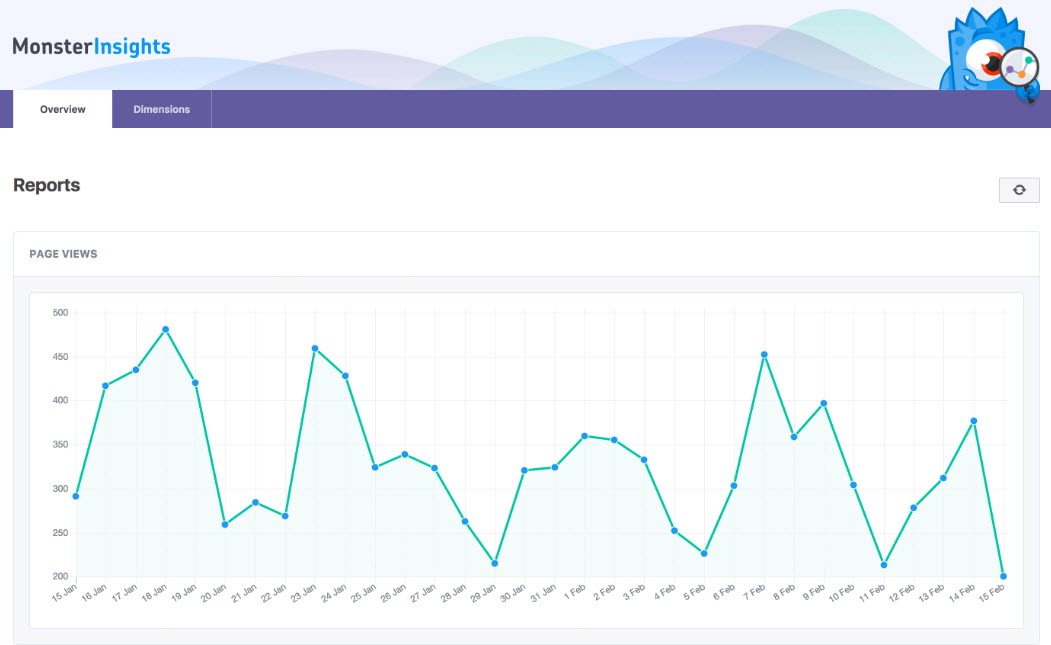
Monster Insights not only integrates your site with Google Analytics, it also creates its own metrics reports based on your site’s performance. This data can be viewed within your WordPress dashboard under ‘Insights > Dashboard’.
Monster Insight highlights the most important stats you may need. These include top post and page views, top traffic sources and top countries. Having this data displayed within your WordPress dashboard can be very useful for a quick overview of how your site is performing. However, it can not replace the powerful insights of Google Analytics. So if you choose to track your metrics with Monster Insights, do so alongside the in depth Google Analytics reports.
Final Thoughts
You should now have a good understanding of what Google Analytics has to offer. By helping you analyze your audience and how they interact with your content, you can use this information to improve your website. Also as Google Analytics integrates so easily with WordPress, there’s no reason not to start using this free service today!
Which reports and information from Google Analytics will help you improve your website? Please let us know in the comments below…
Megan Jones
Latest posts by Megan Jones (see all)
- What is a Domain Name and How Do They Work? - March 9, 2023
- Using Google Analytics to Track Your WordPress Website’s Performance - September 17, 2021
- Using Jetpack on Your Self Hosted WordPress Website - September 4, 2017
Wonderful article. In recent times, I never go through this kind of useful article. No words to say.
Keep on writing….sorry.. giving this kind of article.
Thanks Venkatesh, glad you like the article!
Great article!
There’s so much to Google Analytics that is can be hard to know where to start or really what it can do.
This explains it nicely.
Joe
Thanks Joe, glad you found it useful!